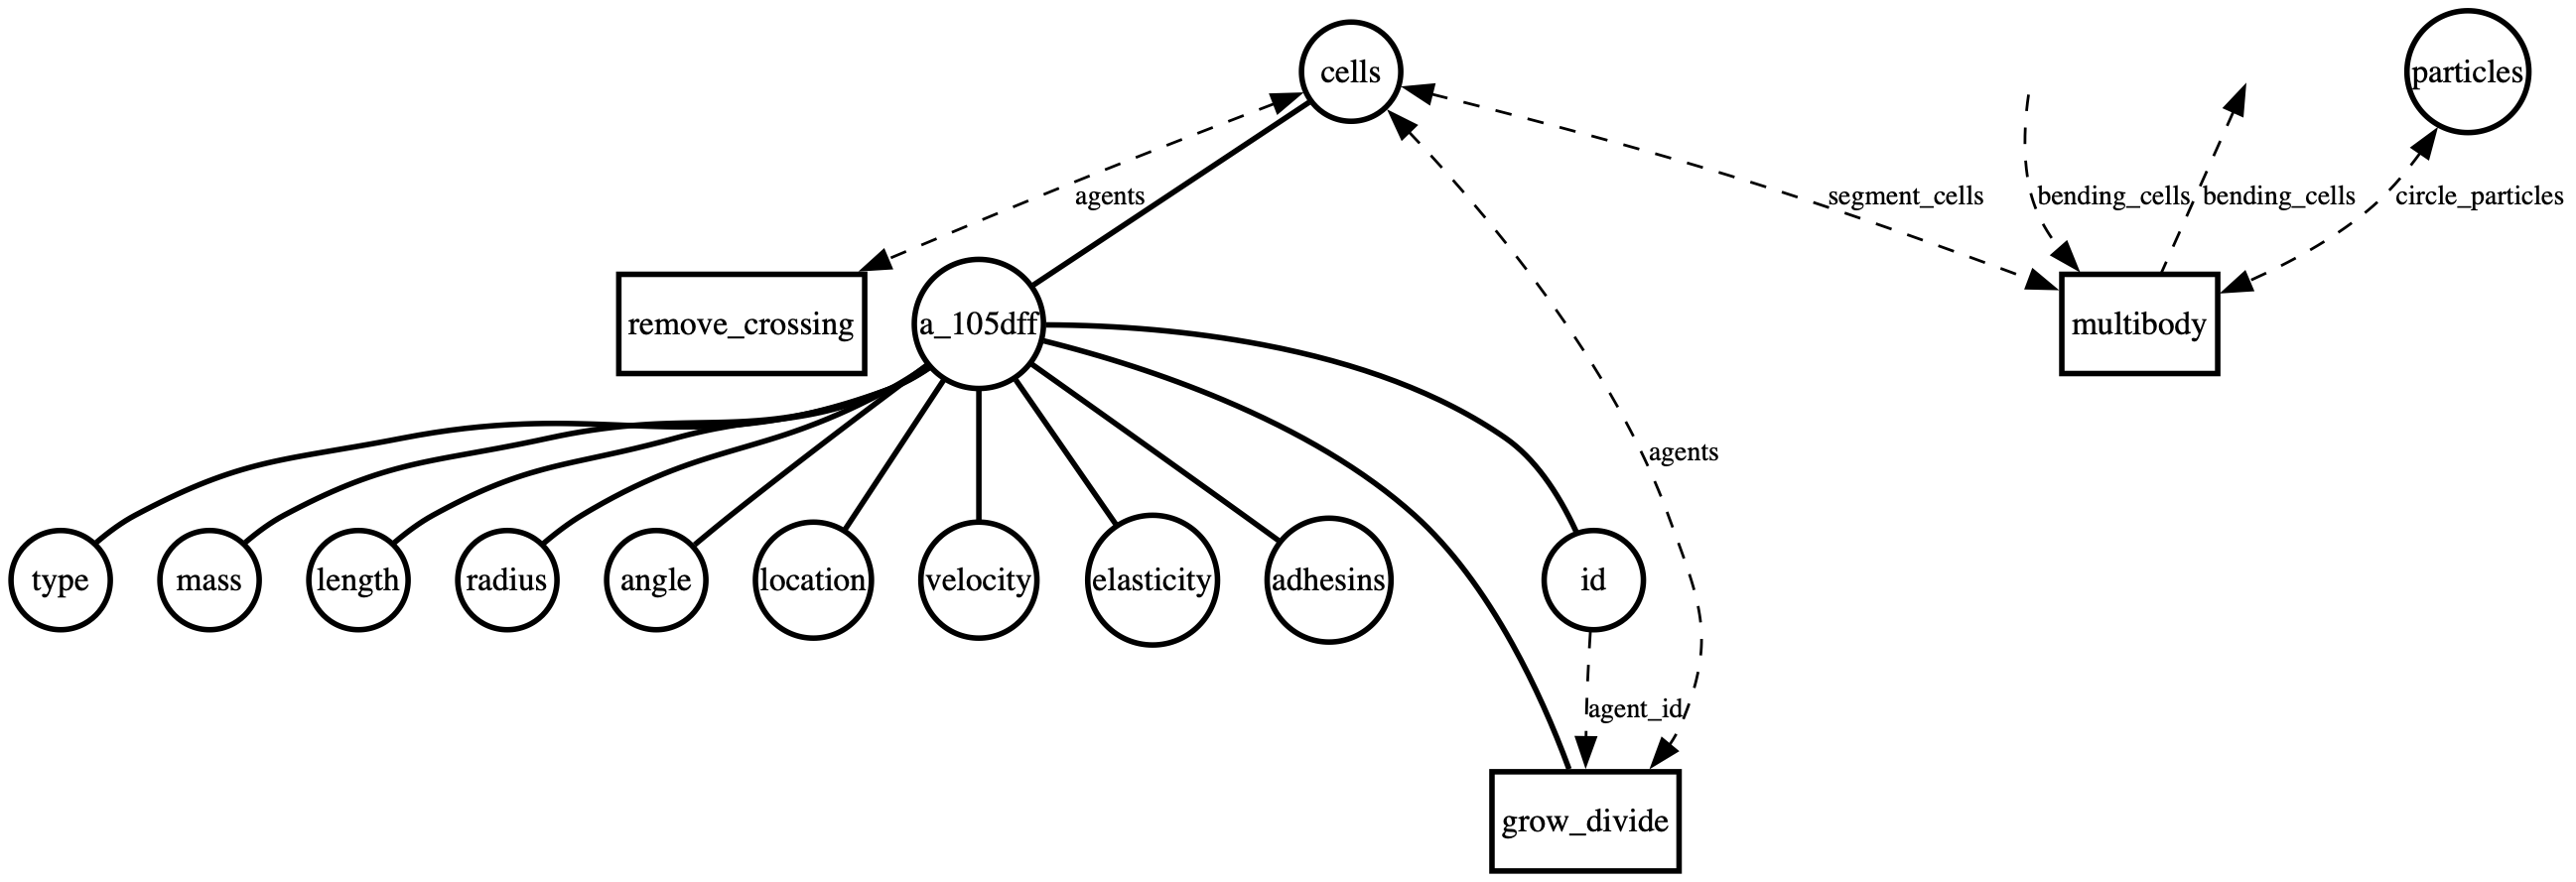
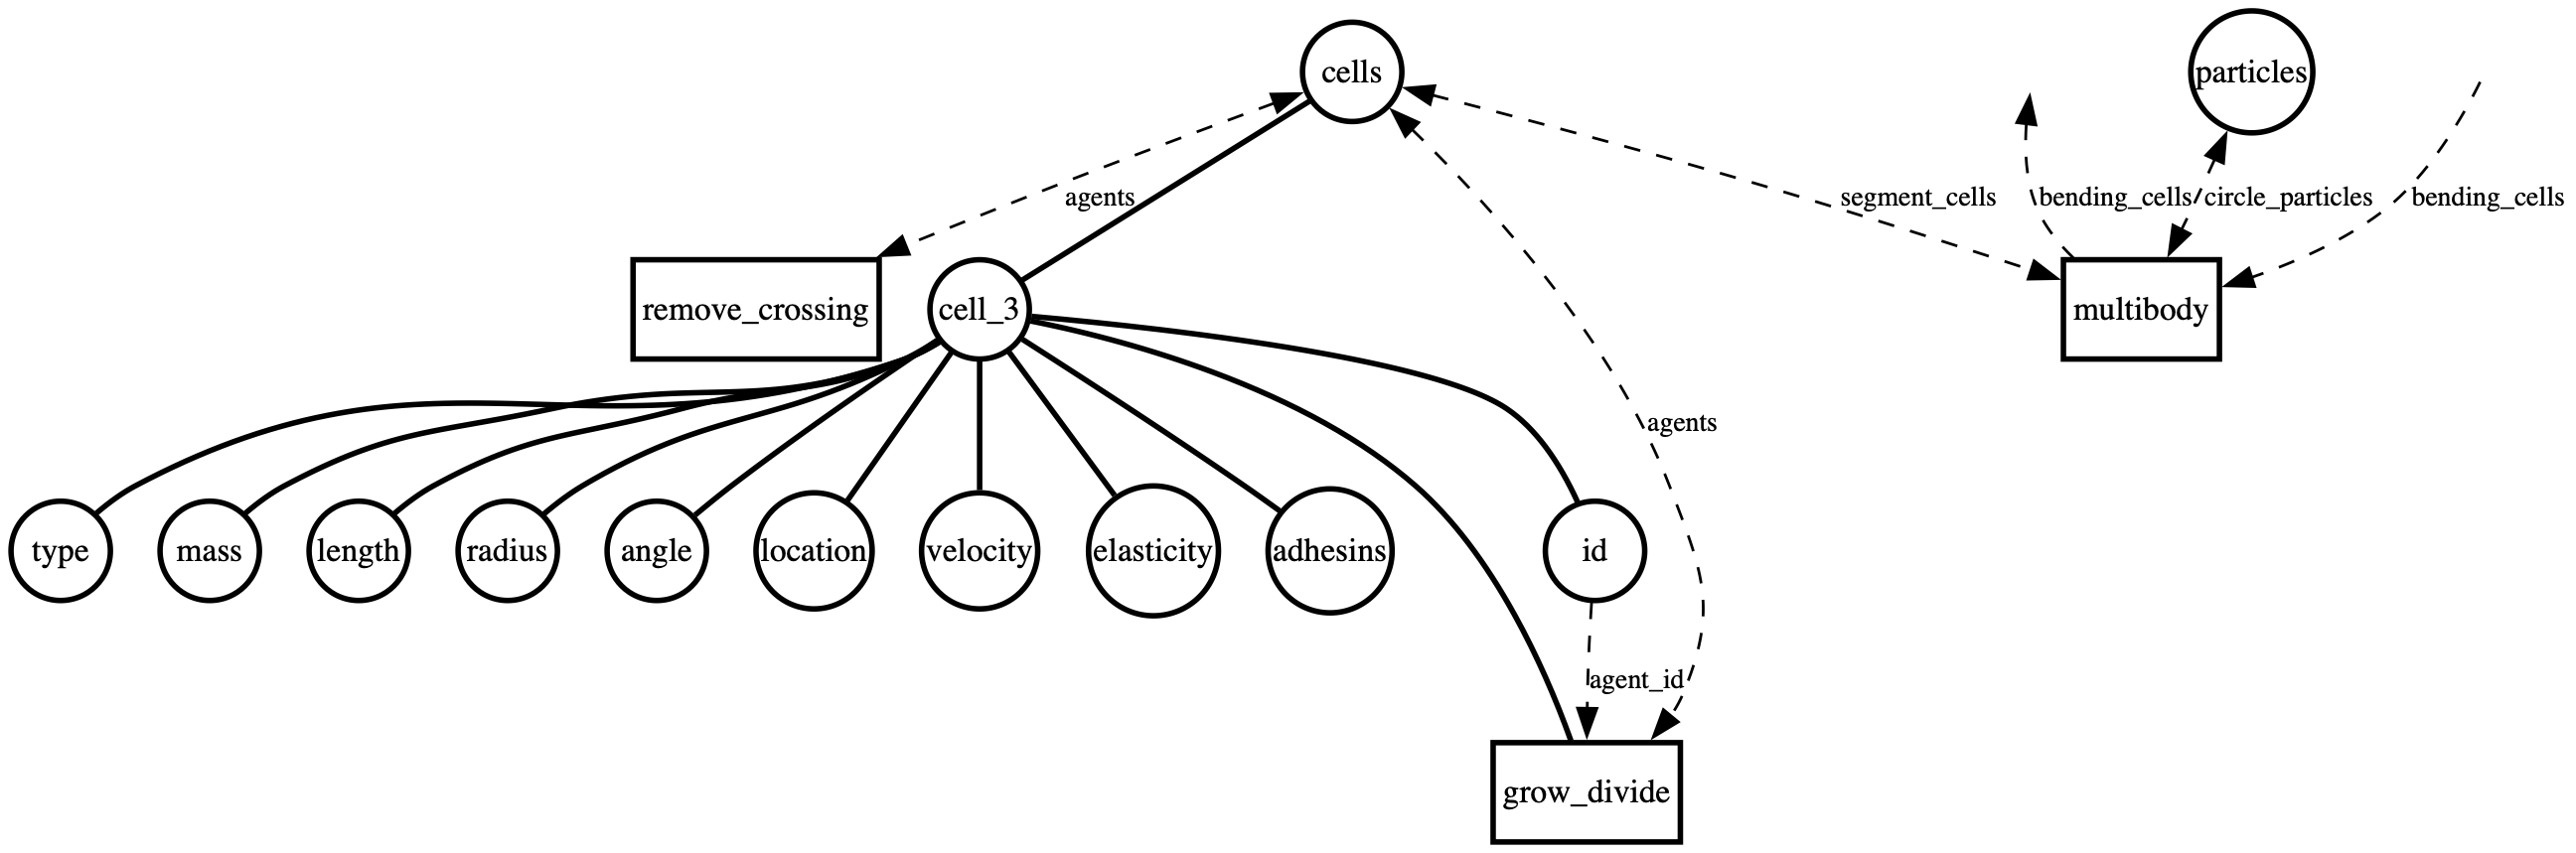
A single E. coli-scale microbe grows and divides in an open chamber with an absorbing right wall. Daughters drift toward the right boundary and are removed when they cross it, keeping the population growing without bound.
Simulation time
28800.0s (8.0 hours)
Steps emitted
961
Final cells
370
Final particles
0
Wall-clock time
20.8s
Simulation
Composition
Initial State
Mother Machine
E. coli-scale cells seeded at the bottom of narrow dead-end channels (~1.5 um wide). Cells grow vertically and divide; daughters are pushed upward. Cells crossing the flow channel (top) are removed from the simulation.
Simulation time
14400.0s (4.0 hours)
Steps emitted
481
Final cells
166
Final particles
0
Wall-clock time
37.0s
Simulation
Composition
Initial State
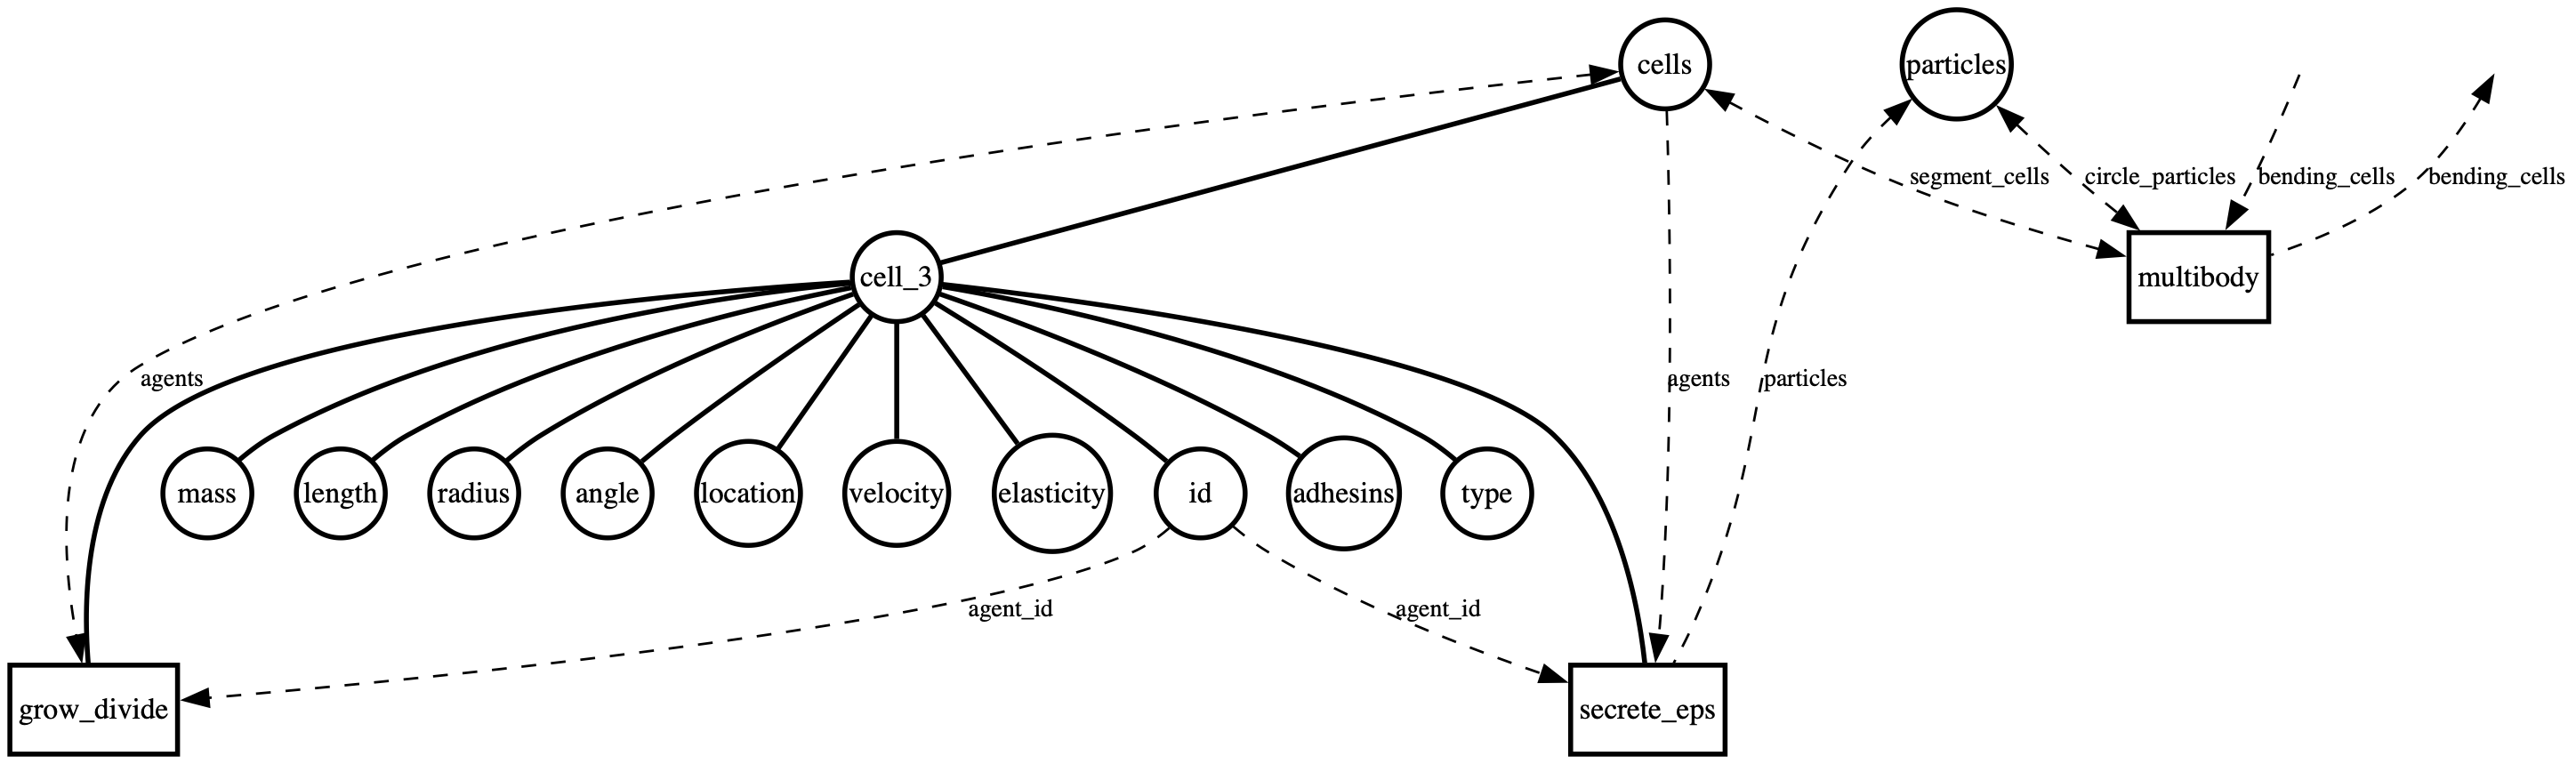
With Particles
Multiple E. coli-scale cells grow and divide in an environment seeded with passive particles whose sizes follow a scale-free (log-uniform) distribution. A few large boulders share the chamber with many small grains; cells push and rearrange them as they grow.
Simulation time
14400.0s (4.0 hours)
Steps emitted
481
Final cells
175
Final particles
400
Wall-clock time
20.4s
Simulation
Composition
Initial State
Bending Pressure
A single cell grows into a colony of multi-segment bending capsules. A Pressure step computes per-cell mechanical pressure from neighbor and wall contacts; GrowDivide inhibits growth as rate * exp(-pressure / pressure_k). Cells under high mechanical pressure grow more slowly AND visibly bend, so the colony shows both compositional inhibition (red interior) and physical deformation.
Simulation time
28800.0s (8.0 hours)
Steps emitted
961
Final cells
115
Final particles
0
Wall-clock time
10.8s
Simulation
Composition
Initial State
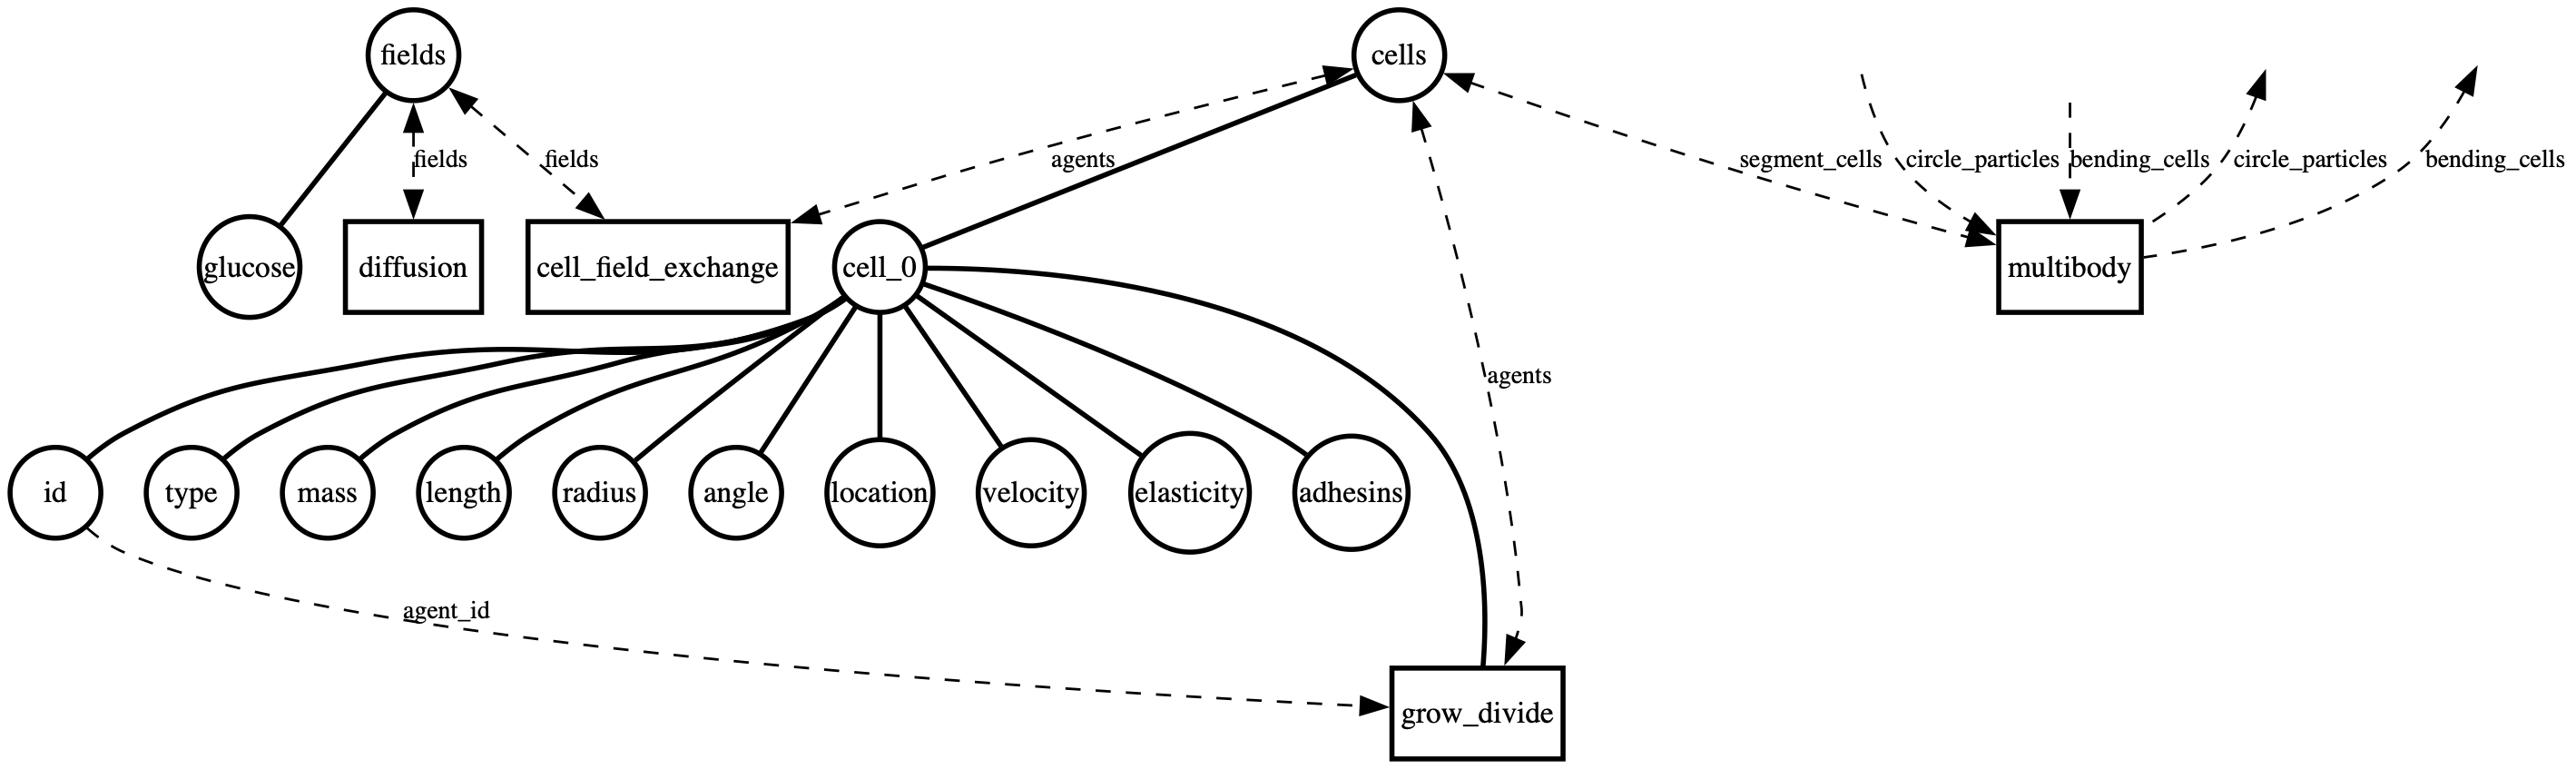
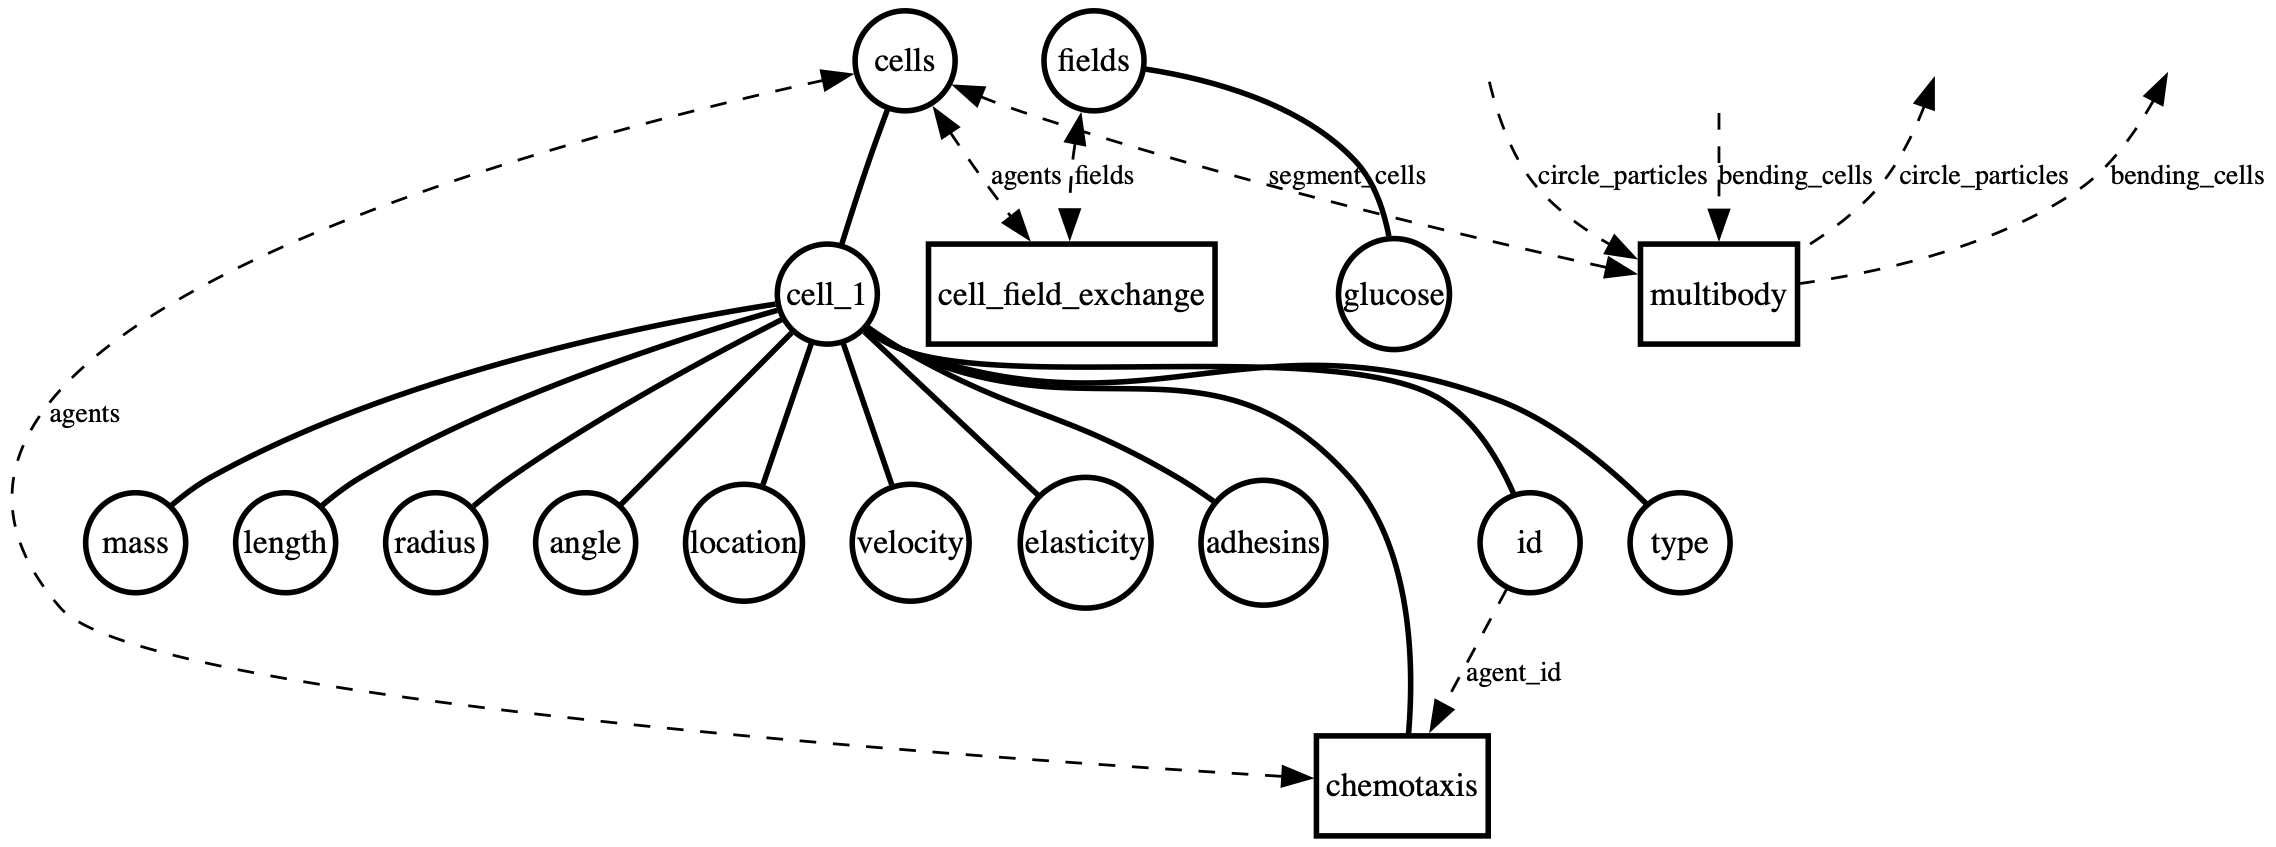
Glucose Growth
Cells grow on a 2D glucose field. A DiffusionAdvection process spreads the glucose; CellFieldExchange runs every tick to sample the local concentration onto each cell and apply the cell's consumption back into the field bin. GrowDivide gates rate by Monod kinetics rate × glucose / (K_s + glucose), so cells slow and stop growing as their local glucose runs out. Units: μm, mM, s; bins are 3 μm so a single cell fits inside one grid site. The background heatmap shows glucose, with a colorbar on the right.
Simulation time
28800.0s (8.0 hours)
Steps emitted
961
Final cells
399
Final particles
0
Wall-clock time
72.8s
Simulation
Composition
Initial State
Attachment
Cells start with adhesin molecules that let them attach to the bottom surface. When a cell touches the surface and carries enough adhesins, a PivotJoint pins it in place. Adhesins split between daughters at division, so descendants of an attached lineage gradually exhaust the pool and the youngest cells eventually fail to attach.
Simulation time
14400.0s (4.0 hours)
Steps emitted
481
Final cells
124
Final particles
18
Wall-clock time
7.3s
Simulation
Composition
Initial State
Chemotaxis
A dozen tiny non-growing cells perform memory-based run/tumble chemotaxis in a long, narrow chamber (1500 × 250 µm) with a static exponential ligand gradient (peak 20 µM at x=0, 1/e decay length 600 µm) so cells can sense the gradient even from the far right wall. Each cell maintains a one-variable smoothed memory c_memory of its local concentration (exponential moving average, τ = 3 s) and computes dc/dt_smoothed = (c_now − c_memory)/τ. Its tumble rate is λ = λ₀ · exp(−k · dc/dt_smoothed), clamped to [0.1, 5.0]/s, with λ₀ = 1.0/s and k = 2.0 s/µM. RUN: cell swims at exactly 20 µm/s in its current heading. TUMBLE: cell stops for 0.1 s and then turns by Normal(0°, 68°) relative to its current heading. PymunkProcess sets body.velocity directly each substep so the swimming speed is exact, and seeded cells swim left up the gradient.
Simulation time
3600.0s (1.0 hours)
Steps emitted
36001
Final cells
12
Final particles
0
Wall-clock time
40.6s
Simulation
Composition
Initial State
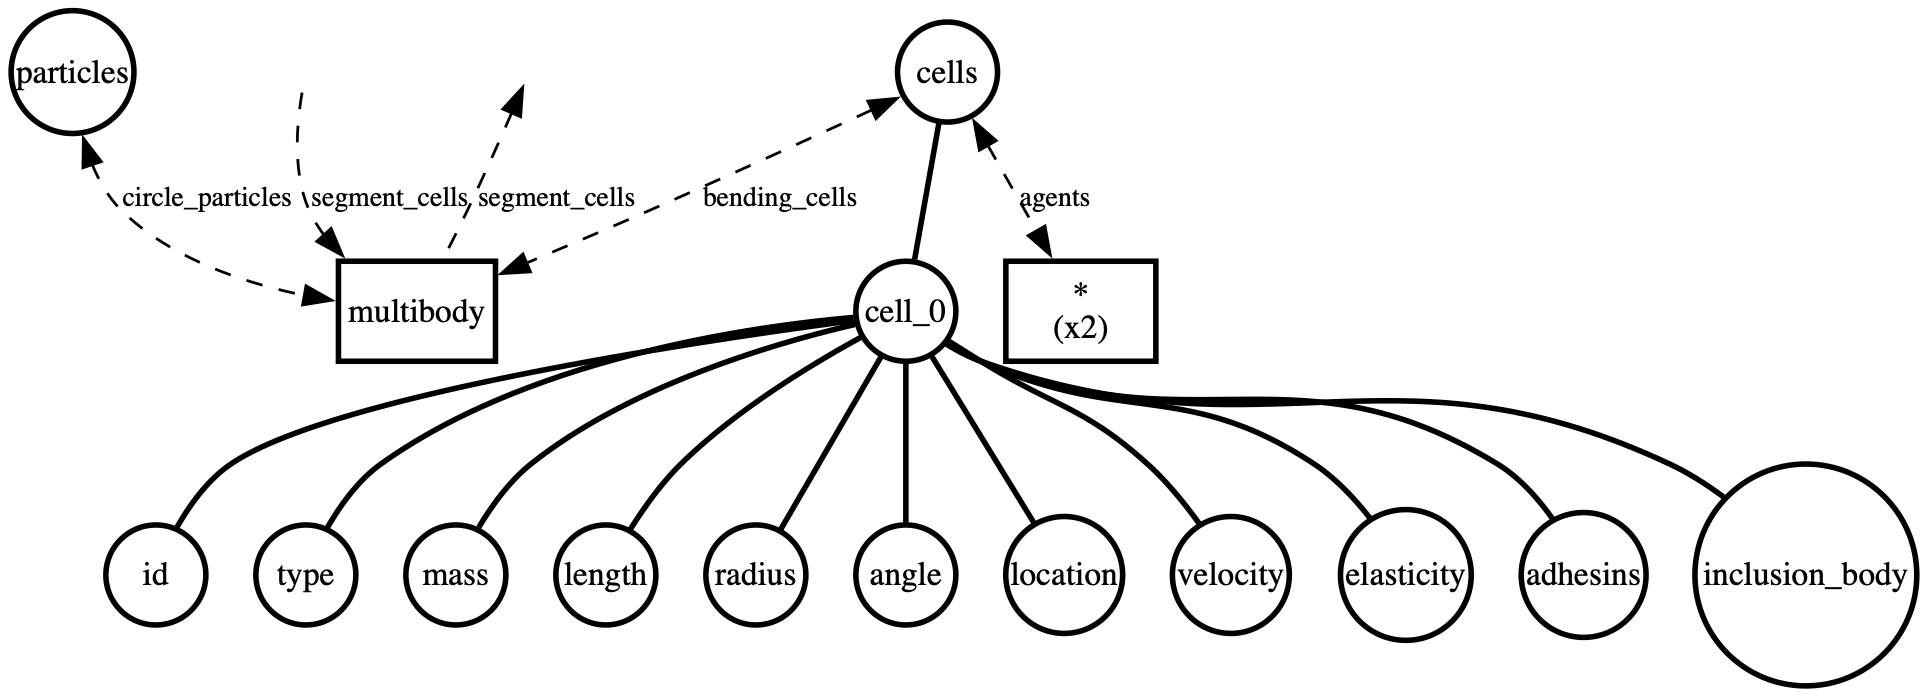
Inclusion Bodies
Inclusion bodies (IBs) are dense aggregates of misfolded protein that form at the cell pole during heterologous protein expression in E. coli. This experiment grows a colony for 10 h while each cell accumulates an IB (size tracked in nanometers, logistic growth toward an 800 nm plateau — hGH-like slow-growing regime). Aggregation imposes a metabolic burden that slows growth proportionally to IB size. At division the full IB goes to one daughter (old-pole lineage) while the other starts clean (new-pole), so IB-free daughters visibly out-grow their IB-laden siblings. Cells are multi-segment bending capsules, and a Pressure process adds a second mechanical slowdown as the colony packs. Cells are colored by IB size (plasma colormap, 0–800 nm).
Simulation time
36000.0s (10.0 hours)
Steps emitted
1201
Final cells
137
Final particles
0
Wall-clock time
9.3s
Simulation
Composition
Initial State
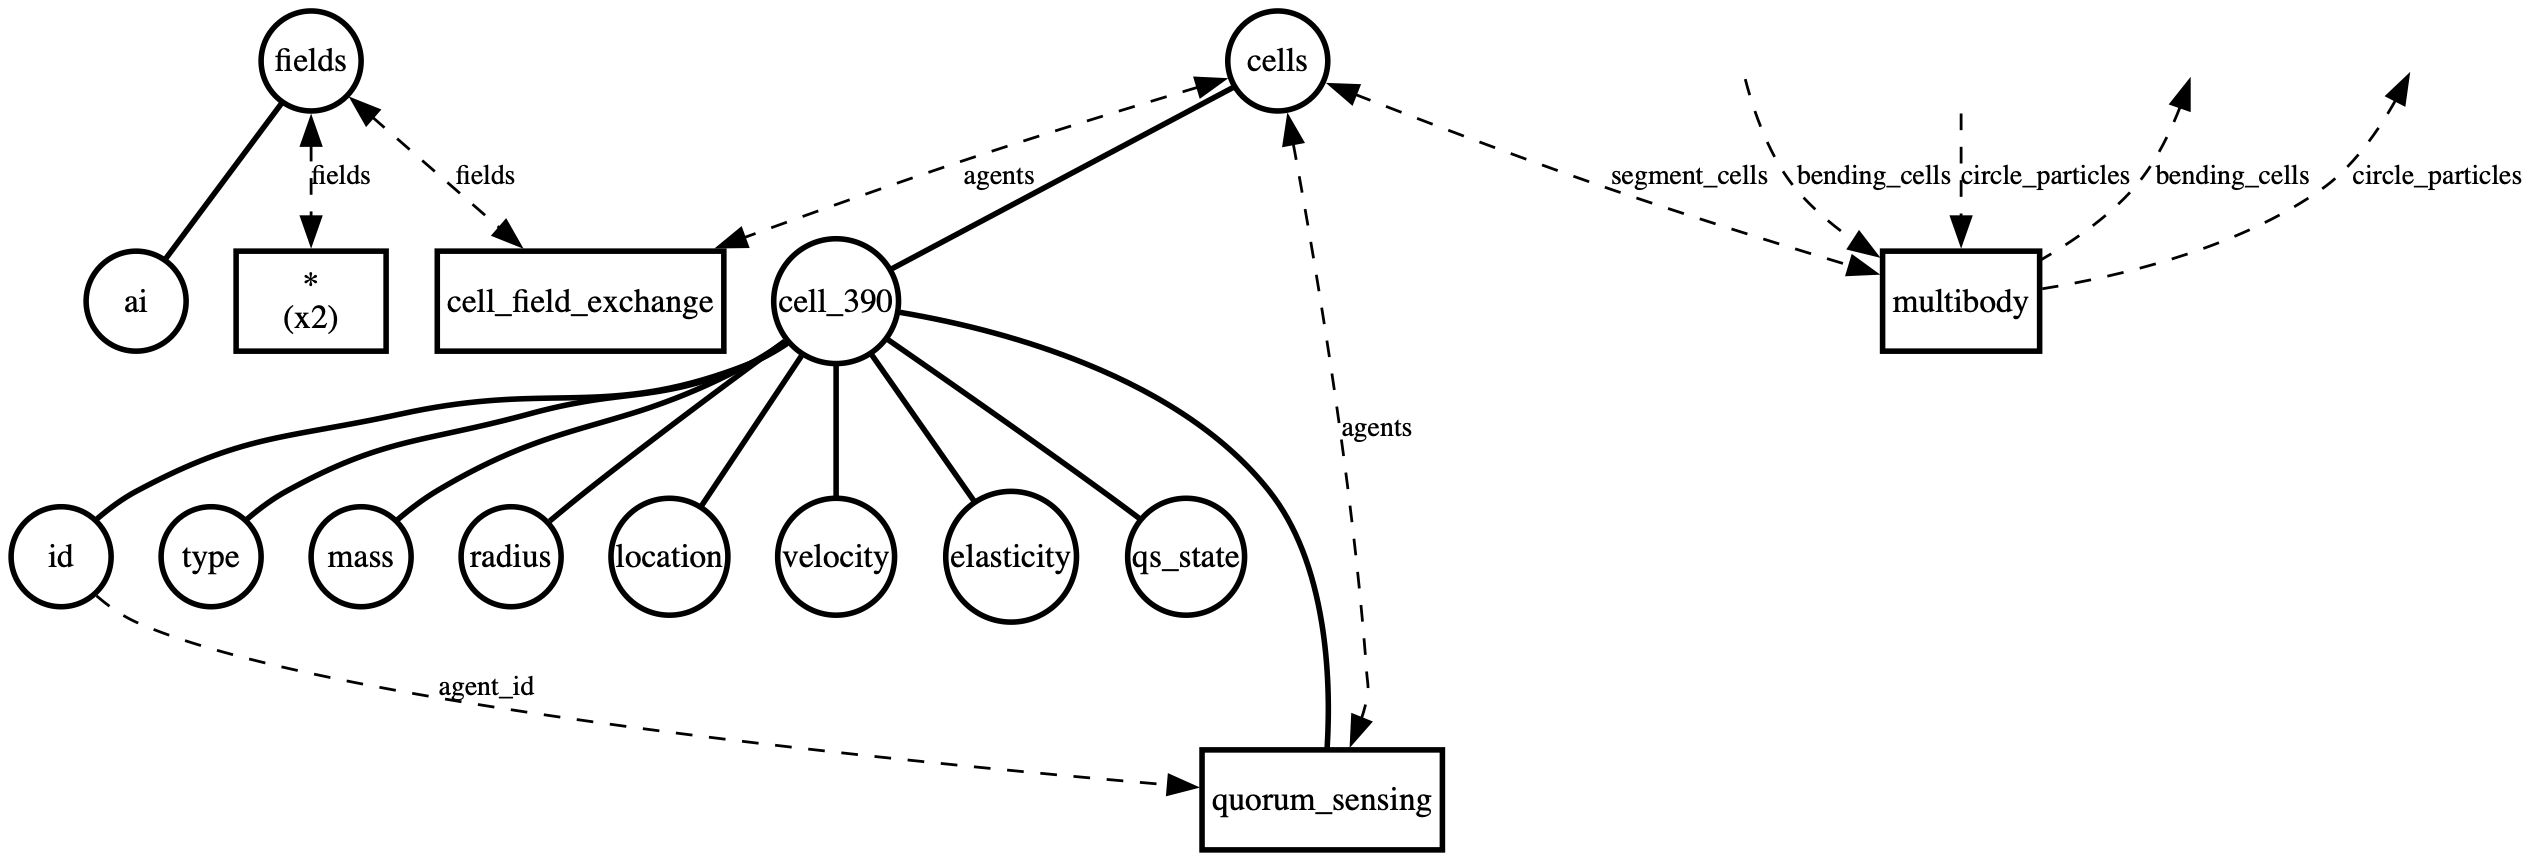
Quorum Sensing
A 100 µm chamber seeded with ~500 non-growing circular bacteria (0.5 µm radius, E. coli / Vibrio scale) at spatially heterogeneous density: one dense hotspot, two medium clusters, a loose cluster, and a sparse uniform scatter across the whole chamber. A diffusible autoinducer (AHL-like) field lives on a fine 160×160 lattice (dx = 0.625 µm) and is updated every 1 s. Each cell secretes AI at a small basal rate (3 nM/s at its own bin) and, when the local field sampled by CellFieldExchange crosses the Hill threshold K = 7.5 nM (n = 4), ramps secretion up ~7× via positive feedback. A FieldDecay process removes AI uniformly from every bin at k = 0.5/s (bulk-abiotic hydrolysis / background lactonase), and within each cell-bin QuorumSensing applies analytic first-order decay (stable for any k·dt). Together with AI diffusion D = 2 µm²/s these set a spatial coupling length λ = √(D/k) ≈ 2 µm: cells packed tighter than λ share AI and ignite each other past quorum, whereas isolated cells (nearest-neighbor ≫ λ) see only their own plume — which decays faster than it can build above K — and stay OFF. Result: dense clusters light up while the sparse scatter stays dark. Cells are colored by a two-state legend (blue = OFF, magenta = ON at s ≥ 0.5); a purple heatmap shows the AI concentration (nM) with PowerNorm (γ = 0.4) so faint inter-colony signal is visible alongside the bright cluster peaks.